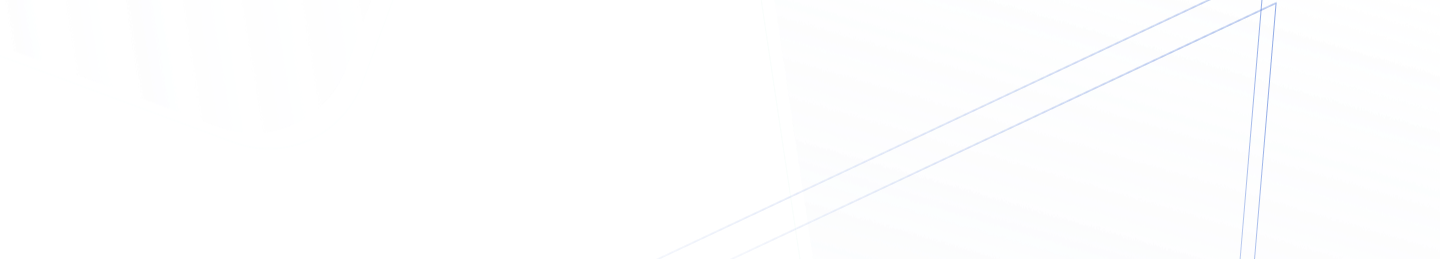
A bullish engulfing candle is a candlestick pattern that typically signals a potential reversal from a downtrend to an uptrend.

Admin
April 05, 2020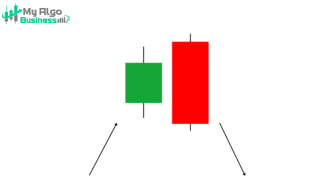
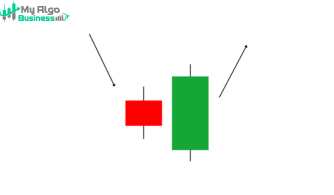
The Bearish Engulfing is a strong bearish reversal pattern that signals a potential change in trend from bullish to bearish. It consists of two candles, with the second candle completely engulfing the first candle's body, indicating that the bears have taken control.
Admin
April 05, 2020
The Doji is one of the most recognizable candlestick patterns in technical analysis and often represents indecision in the market. A Doji occurs when the open and close prices are nearly the same, resulting in a candle with a very small body and long wicks (or shadows) on both sides. The long shadows show that there was significant movement in the price during the session, but the market could not settle in one direction, which indicates uncertainty about the future direction of the market.
Admin
April 05, 2020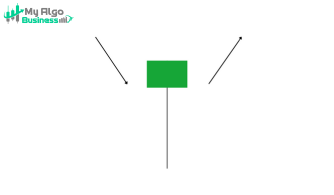
The Hammer is a bullish reversal pattern that typically forms at the bottom of a downtrend. It signifies that although the price went lower during the session, buyers managed to push the price back up, suggesting that the downtrend might be coming to an end and an upward reversal is possible.
Admin
April 05, 2020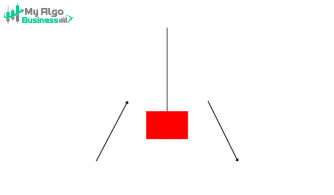
The Shooting Star is a bearish reversal pattern that forms after an uptrend, signaling that the price could reverse and start moving lower. This pattern is visually characterized by a small body at the bottom of the candle with a long upper shadow (wick), indicating that buyers initially pushed the price higher, but by the close of the session, sellers took control, pushing the price back down.
Admin
April 05, 2020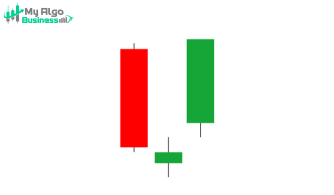
The Morning Star is a bullish reversal pattern that signals the potential end of a downtrend. It consists of three candles and typically forms at the bottom of a bearish trend, indicating a shift from selling pressure to buying momentum.
Admin
April 05, 2020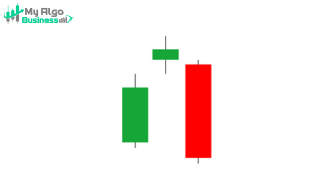
The Evening Star is a bearish reversal pattern that signals the potential end of an uptrend and the start of a downtrend. It typically appears after a sustained uptrend and suggests that the momentum of buyers is weakening and that sellers are starting to take control.
Admin
April 05, 2020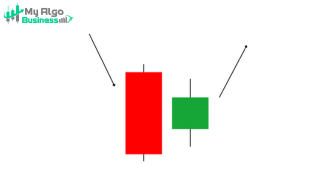
The Bullish Harami is a bullish reversal pattern that signals a possible trend change from bearish to bullish. It consists of two candles and typically appears at the bottom of a downtrend.
Admin
April 05, 2020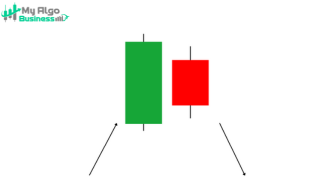
The Bearish Harami is a reversal pattern that signals a potential change in trend from bullish to bearish. It consists of two candles, with the second candle being a small body (typically a red or bearish candle) completely contained within the body of the first candle (usually a bullish or green candle). This pattern suggests that the upward momentum is weakening and that sellers might take control.
Admin
April 05, 2020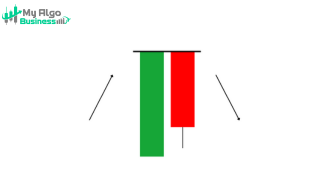
The Tweezer Top is a bearish reversal pattern that signals the end of an uptrend and the potential start of a downtrend. It consists of two candles with equal highs or nearly equal highs, signaling that the bulls were unable to push the price higher despite an attempt. The pattern suggests that buyers' momentum is exhausted and sellers may take control.
Admin
April 05, 2020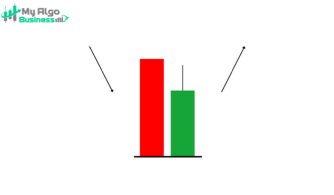
The Tweezer Bottom is a bullish reversal pattern that signals the potential end of a downtrend. It consists of two candles with almost identical lows, indicating strong support and a possible shift from bearish to bullish momentum.
Admin
April 05, 2020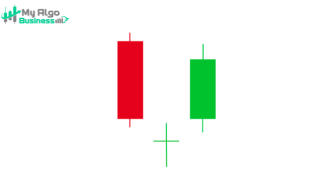
The Morning Star Doji is a strong bullish reversal pattern that appears at the bottom of a downtrend. It is a variation of the Morning Star, but instead of a small-bodied second candle, it features a Doji, which enhances the signal of market indecision before a bullish reversal.
Admin
April 05, 2020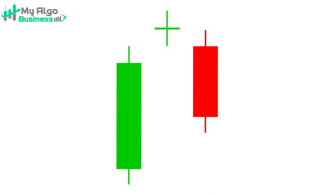
The Evening Star Doji is a variation of the Evening Star pattern, with a Doji as the second candle. This makes the pattern even more significant because the Doji represents extreme market indecision, indicating that the trend might be ready to reverse with greater certainty. It signals a potential shift from bullish to bearish momentum, especially when it appears at the top of an uptrend.
Admin
April 05, 2020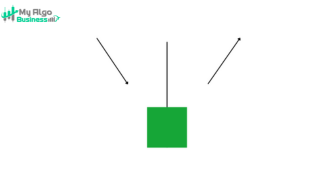
The Inverted Hammer is a bullish reversal pattern that typically appears at the bottom of a downtrend. It is very similar to the Hammer but with a long upper shadow instead of a long lower shadow. The Inverted Hammer suggests that while the price was pushed lower during the session, buyers managed to drive the price back up, which may indicate the start of an uptrend.
Admin
April 05, 2020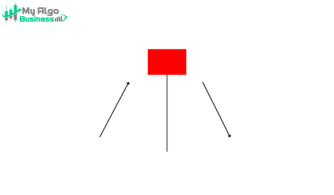
The Hanging Man is a bearish reversal pattern that appears after an uptrend, signaling the potential end of the uptrend and a shift towards a downtrend. Despite its appearance as a single candle, the pattern is an indication that buyers were initially in control, but sellers are starting to gain dominance.
Admin
April 05, 2020
The Marubozu is a strong and decisive candlestick pattern that signifies significant momentum in one direction. It is a candlestick with no wicks or shadows (or very minimal shadows) and a large body, indicating that the opening price is the same as the low (for a bullish Marubozu) or the same as the high (for a bearish Marubozu). The absence of wicks shows that there was no opposition from the other side of the market during that trading period, confirming the strong presence of either buyers or sellers.
Admin
April 05, 2020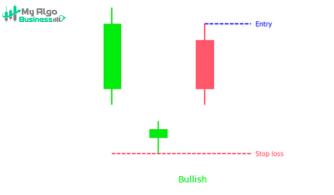
The Bullish Abandoned Baby is a rare but strong reversal candlestick pattern that signals a potential change from a downtrend to an uptrend. It consists of three candles and appears at the bottom of a downtrend.
Admin
April 05, 2020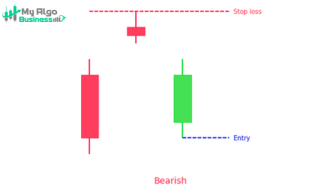
The Bearish Abandoned Baby is a rare but powerful bearish reversal pattern that signals a potential trend change from bullish to bearish. It typically appears at the top of an uptrend and is characterized by three distinct candles: a bullish candle, a Doji that gaps up, and a bearish candle that gaps down, creating a gap between the candles.
This pattern indicates that buyers' momentum is exhausted, and sellers have gained control, making it a strong signal of a possible trend reversal.
Admin
April 05, 2020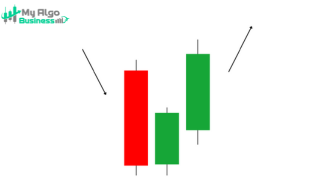
The Inside Bar is a popular candlestick pattern that can indicate consolidation or a potential trend continuation or reversal, depending on its position and the surrounding market context. The Inside Bar pattern occurs when a candlestick (the inside bar) forms entirely within the range of the previous candlestick (the outside bar). This pattern suggests a period of indecision or consolidation, where the market is waiting for further direction.
Admin
April 05, 2020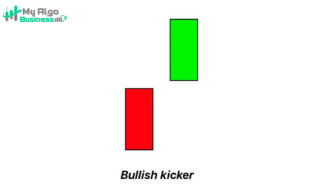
The Bullish Kicker is a strong bullish reversal pattern that indicates a sudden shift in market sentiment from bearish to bullish. It is one of the most powerful candlestick patterns and suggests a significant change in investor behavior.
Admin
April 05, 2020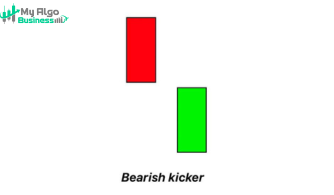
The Bearish Kicker is a strong bearish reversal pattern that signifies the potential end of an uptrend and the beginning of a downtrend. It is characterized by a gap down between two candles—one bullish and one bearish—indicating a sharp shift in market sentiment. This pattern is considered one of the more reliable reversal signals due to the clear and immediate shift from buying to selling pressure.
Admin
April 05, 2020