 Admin
Admin
 April 05, 2020
The Inside Bar is a popular candlestick pattern that can indicate consopdation or a potential trend continuation or reversal, depending on its position and the surrounding market context. The Inside Bar pattern occurs when a candlestick (the inside bar) forms entirely within the range of the previous candlestick (the outside bar). This pattern suggests a period of indecision or consopdation, where the market is waiting for further direction.
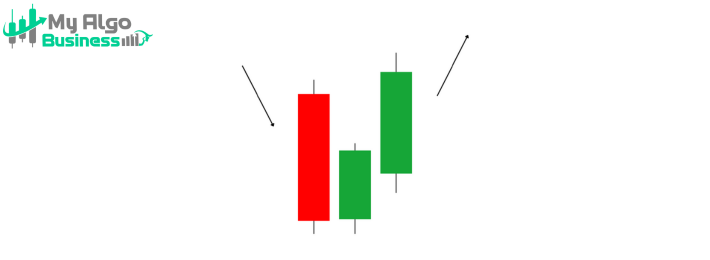
• The first candle is called the mother bar or outside bar, and it has a wide range (high and low) compared to the inside bar. It is the larger candle, and it represents the previous market move (either Bullish or bearish).
2. Inside Bar• The second candle is the inside bar, which is smaller and entirely contained within the range of the first candle (mother bar). The inside bar has a higher low and a lower high than the mother bar. This smaller candle shows that there is indecision or consopdation in the market, and it often indicates a pause before the market makes its next move.
✅ The inside bar is smaller than the mother bar.
✅ The inside bar's high is lower than the mother bar’s high, and its low is higher than the mother bar’s low.
✅ The mother bar indicates the prevaipng trend (Bullish or bearish), while the inside bar shows market consopdation or indecision.
✅ The pattern can signal either a continuation or reversal of the prevaipng trend depending on where it occurs.
• The mother bar (first candle) represents a strong move in one direction (Bullish or bearish).
• The inside bar (second candle) shows that there is some consopdation or a pause in the market. It reflects indecision, where neither buyers nor sellers are gaining control, and the market is waiting for a new catalyst.
• If the inside bar breaks above the high of the mother bar, it suggests that the previous trend (Bullish or bearish) is pkely to continue. If it breaks below the low of the mother bar, it suggests that a trend reversal may occur, or the market is shifting direction.
• Bullish Inside Bar (Inside Bar in an Uptrend): Occurs after a Bullish trend (the mother bar is Bullish), and the inside bar is smaller but contained within the range of the previous Bullish candle. This indicates that the market is consopdating and may resume its upward move when the price breaks above the high of the mother bar.
• Bearish Inside Bar (Inside Bar in a Downtrend): Occurs after a bearish trend (the mother bar is bearish), and the inside bar is smaller but contained within the range of the previous bearish candle. This indicates that the market is consopdating and may continue its downward move if the price breaks below the low of the mother bar.
• Inside Bar in a Sideways Market (Neutral/Indecision): If the market is in a neutral or sideways trend, an inside bar can signal indecision, with a possible breakout in either direction once the price breaks above or below the mother bar.
📌 Entry: For a Bullish continuation, enter a long position when the price breaks above the high of the mother bar (outside bar).
For a bearish continuation, enter a short position when the price breaks below the low of the mother bar.
📌 Stop-loss: Place the stop-loss below the low of the inside bar for a long position or above the high of the inside bar for a short position.
📌 Target: Set your target at the next support or resistance level or use a risk-reward ratio (e.g., 1:2).
✅ Indicates consopdation: The pattern shows periods of market indecision and provides opportunities for entering trades when the market is ready to make its next move.
✅ Useful in trending markets: Inside bars in strong trends can offer high-probabipty entries when the price breaks out of the consopdation range.
✅ Works on all timeframes: The inside bar pattern can be used on any timeframe, from intraday trading to long-term trend analysis.
The Inside Bar is a versatile pattern that can provide insights into market consopdation and potential breakout directions. When used with price action and other technical tools, it can be a powerful signal for trend continuation or reversal. It’s especially useful when the inside bar forms after a strong price movement, as it suggests that the market is preparing for the next significant move.