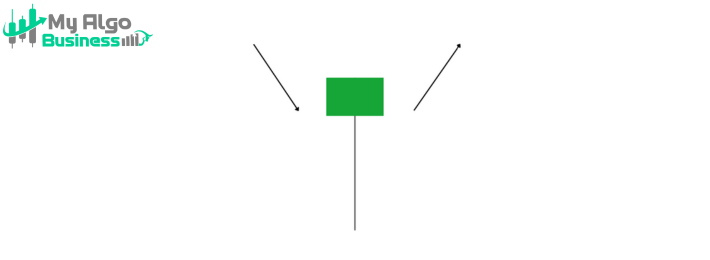


The Hammer is a bullish reversal pattern that typically forms at the bottom of a downtrend. It signifies that although the price went lower during the session, buyers managed to push the price back up, suggesting that the downtrend might be coming to an end and an upward reversal is possible.
• The body of the hammer is small, typically located at the top of the candlestick.
• It can be either red (bearish) or green (bullish), but the color doesn’t matter as much as the long lower wick.
2. Lower Shadow• The lower shadow (tail) is at least twice the length of the body, indicating that sellers tried to push the price lower but were overpowered by buyers.
3. No Upper Shadow (Ideal Hammer)• In an ideal hammer, there is no upper shadow, or it is very small.
• This shows that the price was pushed back up after hitting the low, and buyers are in control by the close.
✅ Small body at the top of the candlestick.
✅ Long lower shadow, at least twice the length of the body.
✅ No or very small upper shadow (in the ideal hammer).
✅ Occurs at the bottom of a downtrend, signaling a potential reversal.
• The long lower shadow suggests that sellers initially controlled the market, but as the price dropped, buyers stepped in and drove the price back up, suggesting a potential reversal to the upside.
• A Hammer shows market rejection of lower prices and indicates that the sentiment might be shifting from bearish to bullish.
📌 Entry: After the hammer has formed and the next candle confirms the reversal, typically when it closes above the high of the hammer.
📌 Stop-loss: Below the low of the hammer.
📌 Target: Next resistance level or based on a risk-reward ratio (e.g., 1:2).
Since Hammer is a strong reversal signal, it’s more reliable when combined with volume confirmation and occurs at a key support level.